GraphQL Demo Screenshots

Real-time performance comparison and key differences visualization

← Back to AWS Projects

Performance Comparison Dashboard

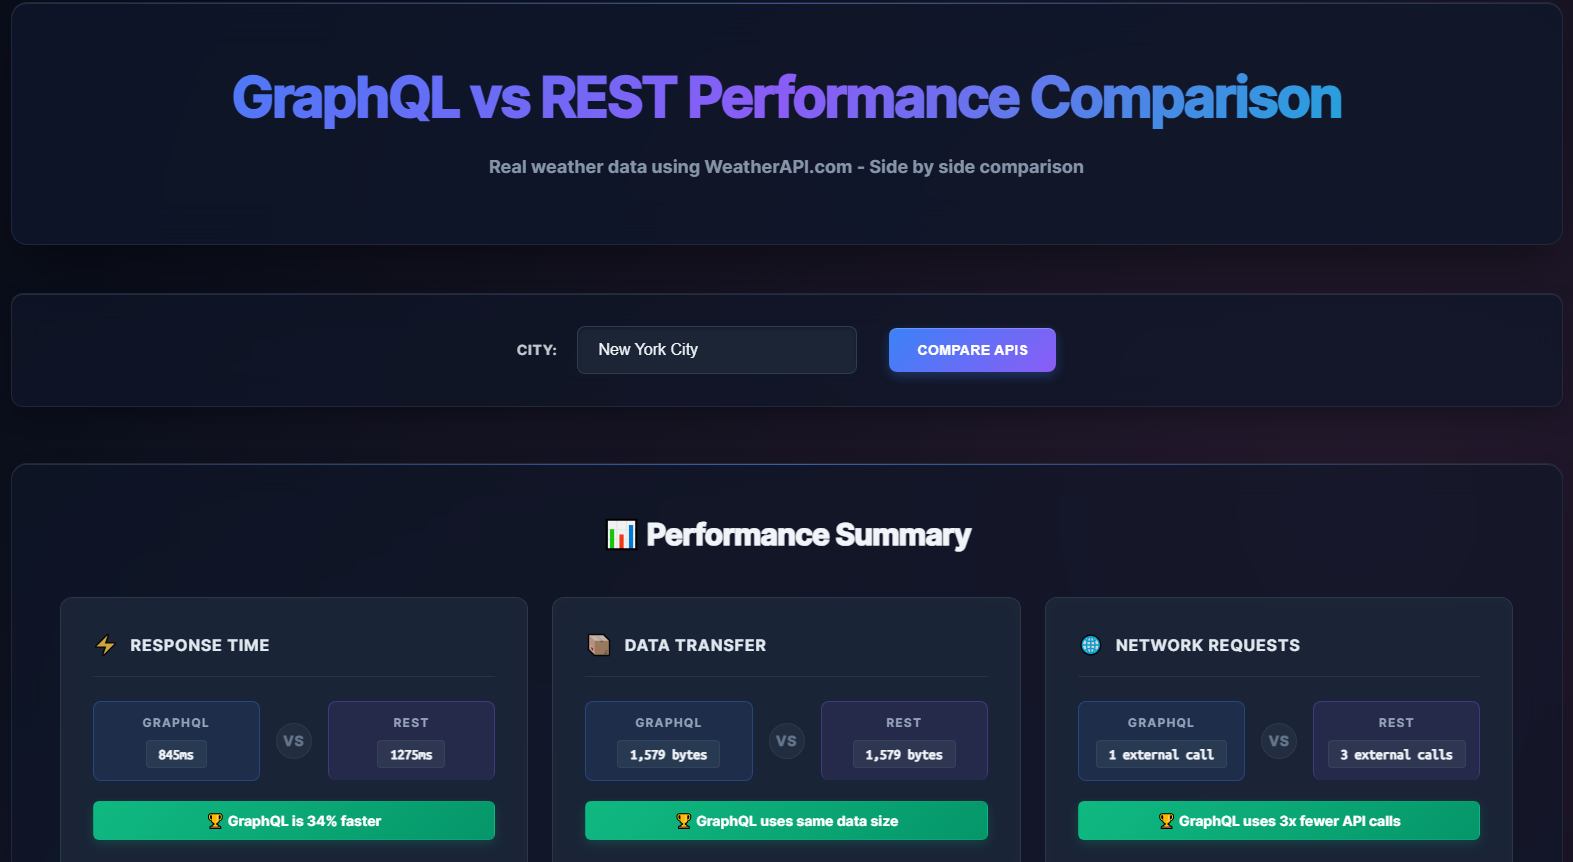
Live side-by-side comparison showing GraphQL is 34% faster with 3x fewer API calls. GraphQL achieved 845ms response time vs REST's 1275ms for fetching weather data from New York City, while both transferred 1,579 bytes - demonstrating GraphQL's efficiency with 1 optimized call versus REST's 3 separate calls.

GraphQL vs REST Performance Metrics

Side-by-Side API Response Display

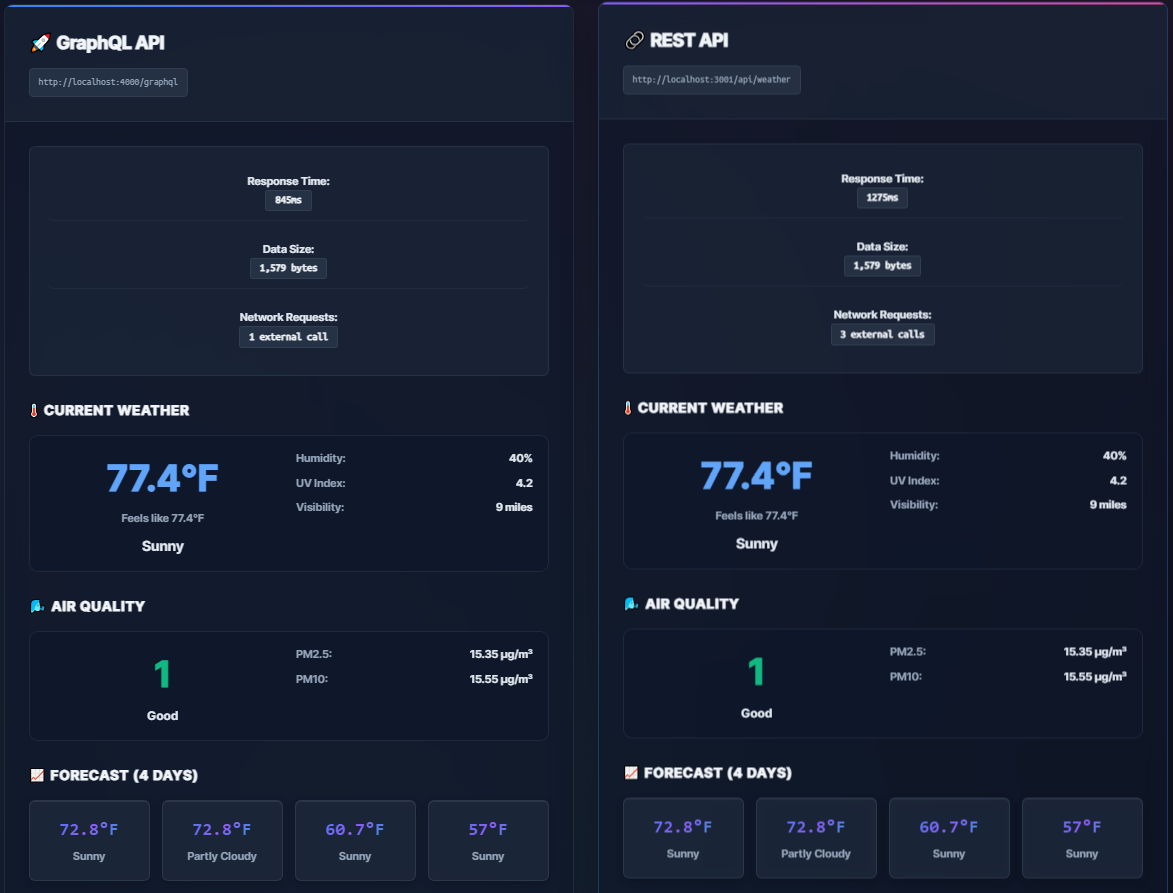
Complete weather data visualization showing identical information returned by both GraphQL (left) and REST (right) APIs. Both display current weather (77.4°F, Sunny), air quality metrics (AQI: 1 - Good), and 4-day forecast. The key difference: GraphQL fetches all data with 1 external call in 845ms, while REST requires 3 external calls taking 1275ms - demonstrating GraphQL's efficiency advantage while delivering the same comprehensive weather information.

GraphQL vs REST Data Comparison

GraphQL vs REST Approach Comparison

Visual breakdown comparing GraphQL advantages (single call for current + forecast + air quality, only requested fields returned, server-side optimization, reduced network overhead) versus REST approach drawbacks (3 separate API calls required, all fields returned causing over-fetching, client-side data combination, more network requests).

GraphQL vs REST Key Differences

Deployment Architecture

Frontend Application

  • React 19 with TypeScript
  • Real-time performance metrics
  • Axios for REST calls
  • GraphQL Request client

Backend Services

  • Node.js Express REST API
  • Apollo GraphQL Server
  • WeatherAPI.com integration
  • Request caching & batching